Here you can find most of the material related to my Master of Computer Science thesis, done at the University of Antwerp (Antwerp, Belgium), under the guidance of prof. dr. Serge Demeyer. The Dutch title of my thesis was:
or in English:
The accompanying Java software package was a microscopic road traffic simulator, called Mitrasim 2000.
Quick navigation:
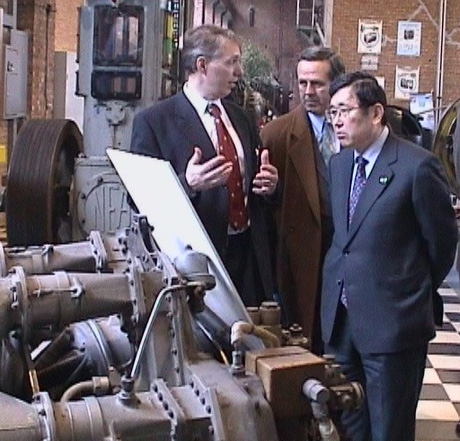
I also got the opportunity to show the resulting work of this thesis during a short demonstration to Shushei Toyoda (i.e., the CEO of Toyota Motor Engineering and Manufacturing Europe), when he paid a visit to ESAT on April 10, 2003.
Introduction
With the ever growing traffic-density on the Belgian highways, the need arises for better ways to make road transport safer and more efficient.
From this point of view, this thesis analyses the influence of several potential solutions, more exactly the fundamental changing of the road-structure (by means of adding an extra lane), the adaptation of the traffic guidelines (concerning speedlimits, the lane usage by trucks, and the imposing of a lane-change prohibition) and changing the driver's behaviour (by eliminating middle-lane drivers).
A microscopic traffic simulator is used as a method for analysis, it is based on a mathematical model that combines the relevant aspects from literature and is adapted to the specific situations on the Antwerp Ring. Based on performed simulations, it can be said that the addition of extra lanes has no significant impact on safety and efficiency. Changes in the traffic-guidelines don't offer a good solution as well. As opposed to this, it seems that understanding the role of middle-lane drivers is very important. A suprising result is that they - when not to abundant - can lead to a more efficient flowing traffic-stream. Because of all this, the research done in this thesis contributes to the acquiring of a better understanding in the complex and dense situations on our highways and it allows us to balance the effect that certain measures have on traffic management and the economy.
It is of the upmost importance that there is going to be a change in the mentality of drivers (they must comply to speed limits, don't take unnecessary risks that diminish the safety), and a general coordination on a large scale (which can lead to the use of Intelligent Transportation Systems) is needed.
Promotor: Serge Demeyer
Advisors: Stijn Dekeyser, Benny Vanhoudt, and Tom Van Woensel.
Screenshots
Click on the thumbnails for larger versions.
|
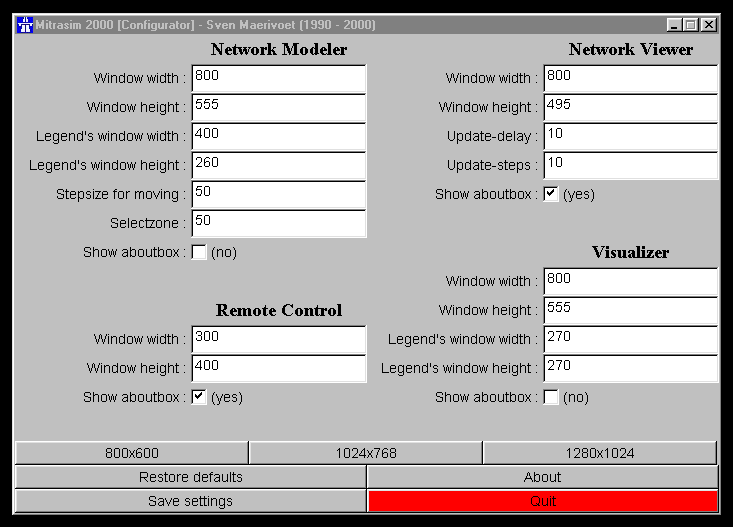
Configurator All the tools of the Mitrasim 2000-suite are preconfigured with a standard set of values that are stored in an INI-file called mitrasim2000.ini.
These values mostly deal with window sizes et cetera, so a tool was
provided which allows a user to quickly change them without any nasty
side effects like incorrectly typed numbers, ...
|
|
|
The graphical user interface. |
|
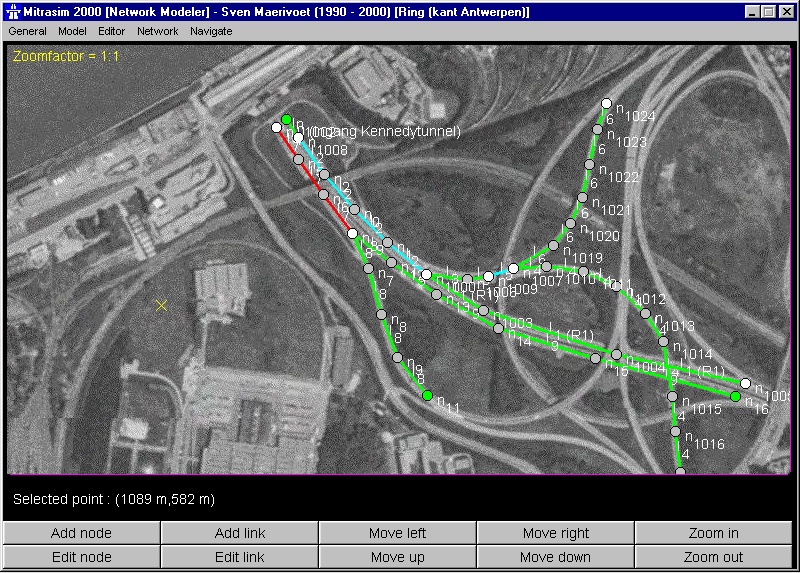
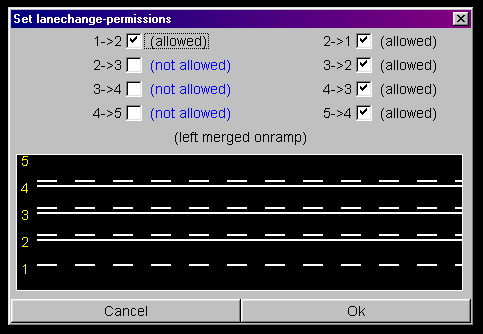
Network Modeller Mitrasim 2000 uses a network-description file that contains the complete layout of the network (nodes, links, and environments). This file can be created manually by specifying each node, link, and environment by hand but this has proven to be awkward and the probability of introducing errors is too high. To accomodate for this, a network modeller was built that simplifies the task: an image (like a satellite photograph) can be used as a background map from which all positions of nodes, ... are derived. So no coordinates need to be specified, they are calculated explicitly. The only thing that must be done is specifying a map, the position of the origin (which is arbitrary), and a scale factor to convert distances on the screen to real-world distances and vice versa. The upshot is that modelling a network goes much faster. An analysis of the network's connectivity can be done to reveal errors in link definitions, ... The network's layout can be saved and later on reloaded so no details get lost. The generated file is fully compatible with every Mitrasim 2000 component. |
|
|
Graphically modelling a network. |
|
Setting the lane change permissions. |
|
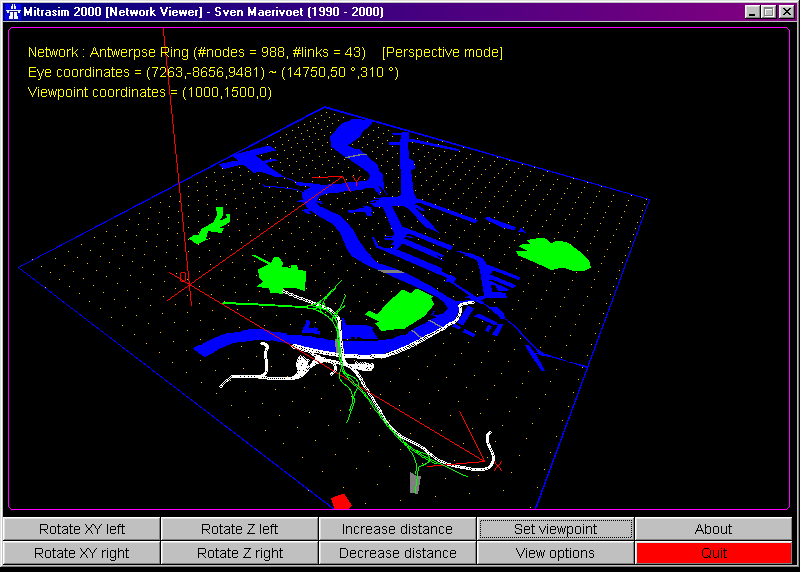
Network Viewer The Network Viewer component of Mitrasim 2000 enables you to preview a network before it is used in a simulation. It creates a 3D environment out of a given network description of nodes, links, and environments. You can view this network from any distance and from any angle in a perspective view or a parallel view. Several things can be seen when rendering:
|
|
|
Viewing a network. |
|
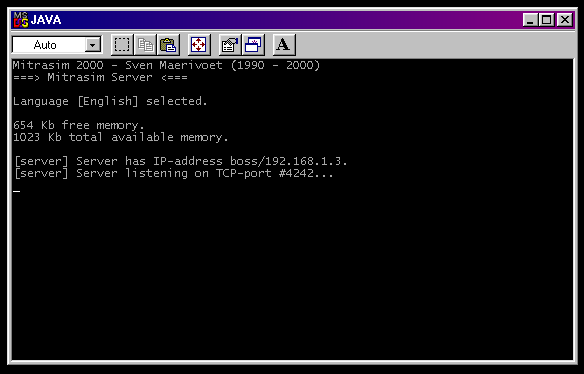
Mitrasim 2000 Server The most important component in the Mitrasim 2000 package is Mitrasim. It acts as a TCP/IP server for clients (like Remote Control and Visualizer) and contains the simulator that is used for performing experiments. Normally, you'll use a dedicated computer in a TCP/IP network that runs the server Mitrasim. Other computers in the TCP/IP network can then establish connections with this server so the computational load (of simulating and graphically rendering) is distributed across several computers. It is even possible to have one server and many Visualizer clients so the simulation proces can be seen from different viewpoints. |
|
|
Mitrasim 2000 is started and ready for action. |
|
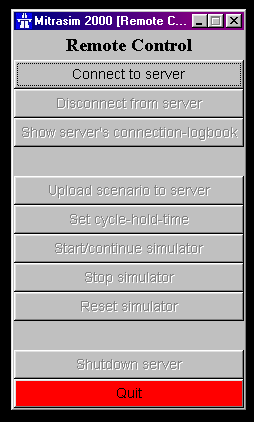
Remote Control Since Mitrasim itself is a server without an explicit user interface, a method has been devised for controlling its behaviour. To this end, Remote Control was written. It's a small piece of software that allows you to establish a connection with a Mitrasim server, upload scenarios to it and start or stop the built-in simulator. |
|
|
Remote Control started. |
|
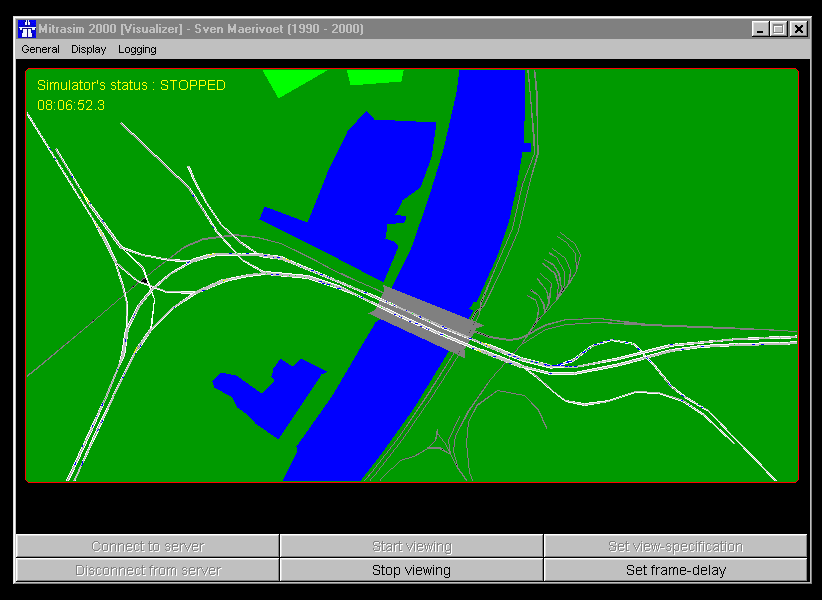
Visualiser Visualizer is a program which allows you to view the proces of simulating traffic. To this end, it allows you to establish a connection with a Mitrasim server and let's you specify a view specification after which it renders 3D-animated frames. Furthermore, it is also possible to log all the data measured by the loopdetectors in the road network, so you can post-process it at a later time using a statistical program. |
|
|
Viewing traffic operations from above (parallel projection). |
|
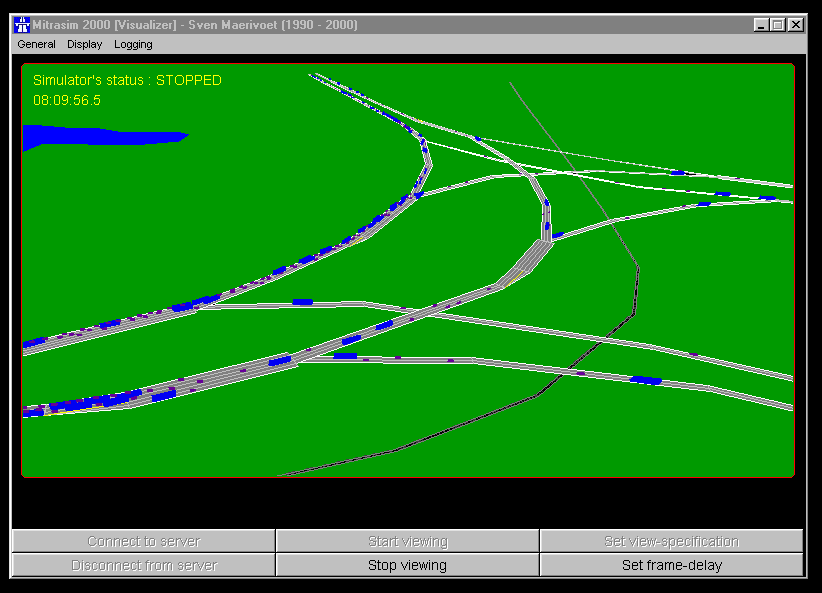
Viewing traffic operations from an arbitrary angle (parallel projection). |
|
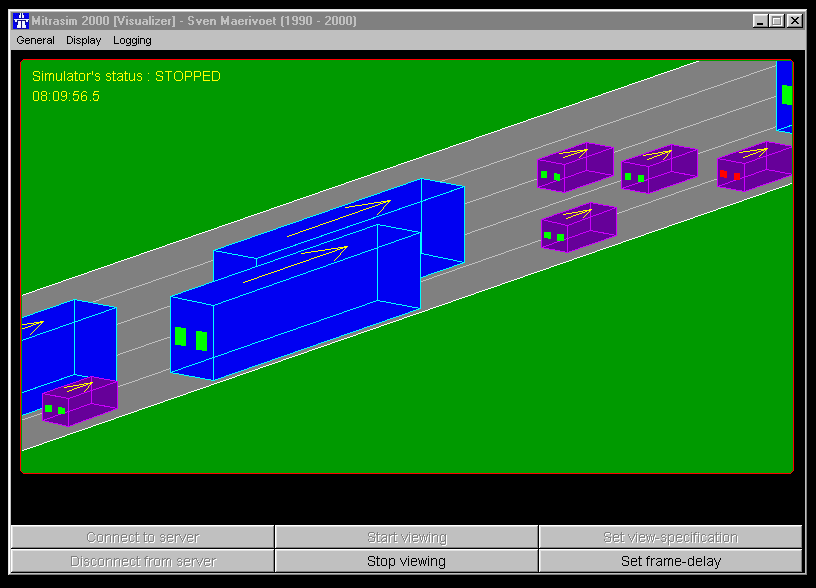
Showing more detail for all the vehicles (parallel projection). |
|
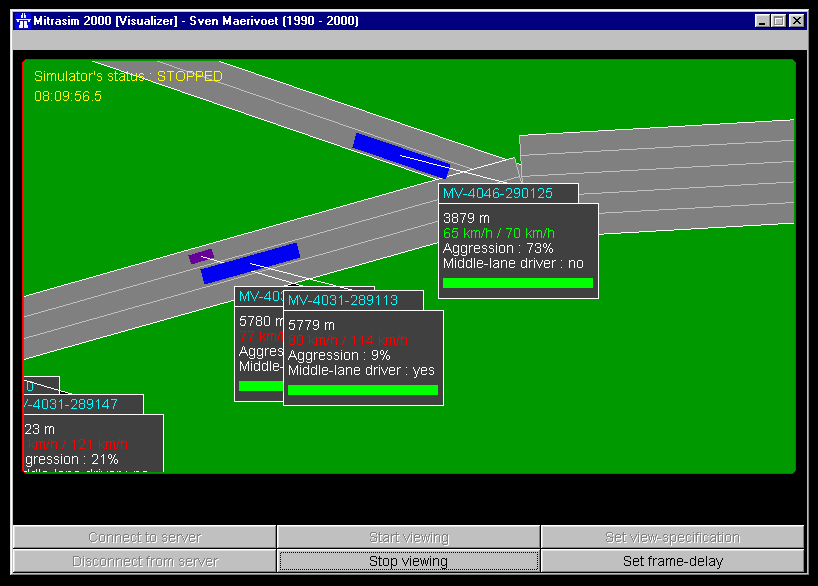
Viewing every vehicle's most important parameters (parallel projection). |
Master's Thesis and Java Source Code
You can download my Master's thesis and the presentation slides (all in Dutch):
Mitrasim 2000 was developed for the Java Virtual Machine and should therefore (theoretically) run on any architecture supporting the Java VM bytecodes. The sourcecode currently consists of 25504 lines of code, accounting for 889 KB (last update: 29/06/2000).
- The source tree (ZIP, 236 KiB)
- The compiled tree (class files) (ZIP, 341 KiB)
- Two road layouts and demonstration scenarios (ZIP, 32 KiB)
For demonstration purposes, I have also made a tailored version of Mitrasim 2000, where the TCP/IP connection is always automatically made on the local machine (and in which the background is changed from black to green, for more visual appeal):
- Demonstration version (ZIP, 1.48 MiB)
Quickstart
How to run the software ?
Mitrasim 2000 consists of six different programs. Each one of
them has a specific task to perform, please read on to gain further insight.
When running a Java program you should always follow the same routine (the
notes below are mainly aimed at Windows users who installed the software in
the D:\Mitrasim2000 directory, whereas I assume that Linux users
more or less implicitly know how to do this...):
- open a command-line interface by executing
C:\WINDOWS\COMMAND.COM, - change to the directory where the software resides by typing the following command at the prompt:
CD D:\Mitrasim2000, - from here on, select a program to execute by reading the next bit of text.
Normally, you will have to execute three programs: these are the server
Mitrasim and the clients Remote Control and Visualizer. So, open three
command-line interfaces (as described above) and change to the
D:\Mitrasim2000 directory. Then execute the following commands
(each command in its own command-line interface window):
java Mitrasimjava RemoteControljava Visualizer
The next sequence of events should fire you up:
- in Remote Control, click on "Connect to server", then click "Ok". When the connection is made, a dialog box will appear, click "Ok". Next, click on "Upload scenario to server" and in the next dialog box, double-click on the filename "scenario.data". To better visualise the simulator's actions, click on "Set cycle-hold-time", type the value "250", press the ENTER key and click "Ok".
- in Visualizer, click on "Connect to server", followed by clicking "Ok". Next, click on "Set frame-delay", fill in the value "0", press the ENTER key and click "Ok". Then, click on "Set view-specification" and select a specification in the list at the top of the dialog box. All the other values should now automatically be filled in, so you can click "Ok".
- go to the Remote Control and click on "Start/continue simulator". Then switch to the Visualizer and observe...
Progress Table
Note that all events are inverse chronologically sorted.
-
June 2001
- Met with Bart De Moor in Leuven and discussed my future at the KUL after graduating.
-
May 2001
- Went to TNO (in Delft, the Netherlands) and had an exchange of ideas.
-
March 2001
- Met with Data4s, a spin-off in Leuven which specialises in data storage and data accessing using various statistical, database-oriented and artificial-intelligence approaches.
-
February 2001
- Met with the Department of Civil Engineering (Arenberg-campus Heverlee, Leuven) at the traffic centre in Wilrijk (Antwerpen).
-
December 2000
- Received a Christmas/New Year greeting card from the Department of Civil Engineering (Arenberg-campus Heverlee, Leuven). I was pleasantly surprised !
-
October 2000
- Received an invitation from the Department of Civil Engineering (Arenberg-campus Heverlee, Leuven).
- Took up the invitation and met with Ben Immers, Jim Stada, Griet De Ceuster, and Steven Logghe: we exchanged some ideas regarding traffic simulations and explained our research to one another.
-
September 2000
- Wrote a report of my thesis defence.
-
June 2000
- Thrown a final glance at the thesis-document, it is now bound together.
- Distributed the thesis document to all the people who helped me, I owe them.
- Send invitations for my thesis presentation to various related and/or interested people.
- Updated the website which looked a bit abandoned.
- Learned to work with the seminar document style of LaTeX in order to create slides.
- Fixed a small bug in the Visualizer's 3D rendering routine (the vehicles Z coordinate wasn't being interpolated on a link's segments, but now it is).
- Learned to work with the Java 3D API which might be integrated in the Visualizer component of Mitrasim 2000 for more realistic rendered images (with lights, shading, and texture-mapping).
- Prepared the final thesis presentation.
- Dropped the usage of the Java 3D API; it couldn't be done within time.
- Embellished the Visualizer with vehicles' brakelights and blinkers, roads coloured according to average speeds and densities and included vehicle-tracking capability.
- Held a preliminary thesis defence.
- Held the thesis defence.
-
May 2000
- Visited the "Ministerie van de Vlaamse Gemeenschap" and had some exchange of ideas, as well as access to their measuring equipment.
- Tom Van Woensel (UFSIA) agreed to be part of the thesis committee.
- Contacted dr. Qi Yang at Caliper and Tomer Toledo at MIT to request some advice dealing with road curvature, driver's aggressiveness, ...
- Performed vehicle counts by using the installation of the traffic police.
- Completed construction of the simulator.
- Completed implementation of the road network to be studied (by using the network modeller and a personal survey of the road layout, lane-change permissions, speed limits, fleet mix, ...).
- Ran several experiments with the simulator and finished the LaTeX document.
- Removed numerous nasty bugs due to sloppy thinking (and much to cutting and pasting) from the simulator; it now works exquisitely well.
-
April 2000
- Received vehicle-counts from the "Ministerie van de Vlaamse Gemeenschap".
- Celebrated my birthday (11/04/1976).
- Wrote the third part (dealing with human factors) of the thesis document.
- Created the first part of the network (Schelde).
- Installed a new computer (Intel P3 667 MHz) which allows me to speed up my work.
- Fixed a bug in the network-save routine in the network modeller.
- Received an invitation from the "Ministerie van de Vlaamse Gemeenschap".
- Wrote the routine for topologically sorting the network.
- Constructed the Visualizer.
- Upgraded my network at home from coax to UTP-5 (it now consists of an AMD K6 233 MHz, an Intel P-III 667 MHz and last (and probably also least) an Intel 80486 DX 40 MHz): this is real computer power !
-
March 2000
- Created the document's table of contents.
- Modified the network modeller to allow editing of lane-change permissions.
- Wrote the document's introduction and the first two parts (dealing with traffic stream characteristics and traffic stream models).
- Successfully contacted the traffic police to gain access to vehicle counts.
- Requested a model master's thesis from the university's secretary.
- Met Tom Van Woensel (PhD student at UFSIA) who constructed TRAQ and nTRAQ which are simulators based on G/G/1 queueing theory.
-
February 2000
- Talked with my promotor about the operation we are about to undertake.
- Finished the network modeller.
- Started modelling the road network using my new network modeller.
- Learned to use LaTeX for typing the thesis document.
- Created my first document dealing with all the mathematics so far used in the thesis.
- Started designing the client/server simulator tool.
- Read an article about "model-view-controllers".
- Demonstrated the use of the network viewer, network modeller, and client/server simulator.
- Modified the website of Mitrasim 2000.
-
January 2000
- Exams (with excellent performance !).
- Worked on the network modeller.
- Visited my promotor who is now a member of the university's personnel.
-
December 1999
- Designing the road network proved to be difficult, so I started thinking about a network modeller.
- Fundamentally altered the underlying network structure: instead of interpolating parabolas I started using interpolating Catmull-Rom splines. Every link in the network now is categorised according to its type.
- Started designing the network modeller.
- Created a large, detailed map of the road network by using Microsoft's Terraserver's satellite pictures.
- Upgraded the network viewer to cope with the splines.
- Devised a solution for the particularly nasty integral that computes the arc length of a link (i.e., the spline it is represented by).
- Studied for exams.
-
November 1999
- Studied "Traffic Flow Theory: A State-of-the-Art Report" by the Transportation Research Board - TRB (project funded by the Federal Highway Administration - FHWA).
- Read "Traffic Perfomance Models I: Fundamentals of Microscopic and Macroscopic Traffic Flow Theory and Performance Models" by Haris N. Koutsopoulos (Volpe National Transportation Systems Center).
- Read "Traffic Perfomance Models II: Examples of Simulation Models: DynaMIT Supply Simulator and MITSIM" by Haris N. Koutsopoulos (Volpe National Transportation Systems Center).
- Added a small didactic example from "Noorderlicht: De automobilist als deeltje" (Tuesday 09/11/1999, NED3).
- Developed the 3D-rendering engine.
- Completed the stand-alone network viewer.
- Documented the network viewer.
- Fixed a bug in the calculation of the straight-line distance of a link.
- Fixed a bug in the network viewer's routine for rendering curved links.
- Started designing the road network around the Kennedy tunnel.
-
October 1999
- Read "Paramics: A System Overview" by Quadstone Limited.
- Read "Paramics: Moving Vehicles on the Connection Machine" by Gordon Cameron (Edinburgh Parallel Computing Center - EPCC).
- Read "Paramics-MP: Design Description" by G. Duncan (EPCC).
- Read "Paramics-MP: Final Report" by G. Duncan (EPCC).
- Received course notes from MIT's summer school dealing with traffic-simulation.
- Created website.
- Changed the name from Mitrasim v2 to Mitrasim 2000.
- Designed a network viewer with 3D-viewing capabilities in mind.
- Defined the method for representing curved links (using a parabola that interpolates three predefined points).
- Solved a particularly nasty integral handling the arc length of a link.
-
September 1999
- Exams (hmmm).
- Designed a general network structure for the traffic simulator.
- Started creating the base classes dealing with the network's structure.
- Designed the multi-lingual interface.
- Designed the parsing of the network's definitionfile.
- Read "A Simulation Laboratory for Evaluation of Dynamic Traffic Management Systems" by Qi Yang (PhD in Transportion at the MIT).
-
August 1999
- Contacted new promotor (Serge Demeyer).
- Written the thesis outline and planned a time table.
- Contacted Haris E. Koutsopoulos (Volpe Center, Cambridge) and requested course notes from MIT's summer school dealing with traffic-simulation.
- Read "Modeling Driver's Acceleration and Lane Changing Behavior" by Kazi Iftekhar Ahmed (PhD in Science in Transportation Systems and Decision Sciences at the MIT).
- Studied for exams.
-
July 1999
- Found a thesis subject worthy of my attention.
- Contacted previous promotor (Jan Paredaens).


